PRESENTS
Top Tips for Successful Forex Trading
PRESENTS
Top Tips for Successful Forex Trading
Congratulations, and thanks for downloading some of our top advice for Forex Trading.
Forex trading is ideal for any size trader. It's certainly more accessible than futures trading which can require larger starting capital.
At the same time, it's very important to focus in on the top performing currency pairs, a strategy that fits your schedule (and capital), as well as having a clear objective when it comes to your trading.
We suggest you learn more about our Dynamic Swing Trader forex trading strategy which we'll be sharing with you in the days ahead. It combines swing trading strategies, with top performing forex pairs and all in just a few minutes of work. Check your emails for more updates.
Mark Soberman
Need to Learn the Basics of Forex Trading?
We put together a Free trading course taking you through the basics you need to get started trading forex.
If you're new to forex, need a refresher or want to simply learn more please go here to request your free video based forex trading course from NetPicks:
https://www.netpicks.com/forex123
Looking for more trading advice, tips and tutorials? Visit our free Trading Tips blog:
https://www.netpicks.com/trading-tips
Header
Some of the best Forex trading tips that can lead to trading success are usually the simple ones. Given that Forex market is popular for both experienced and beginning traders, you know there are quite a few tips available for all traders With low initial deposits depending on your account type, free trading software from your Forex broker, and virtually 24 hours access, it's extremely tempting for people to jump in with both feet without having much in the way of trader training. This page is dedicated to some of the best Forex trading tips covering all currency pairs taken from not only real world trading experience but also from the many Netpicks "family members" who've enjoyed success trading one of our trading systems. Think of it as a checklist you can follow before you start trading to help you get on the right side of success.
When a trader begins to learn Forex trading, we teach them that there are 3 broad categories that make up “what it takes” and these are something that successful currency traders have not only understood, but aim to excel at.
When a Forex trader combines these three pillars of success, they stand a good chance of finding trading success:
Traders can lump virtually any trading tip into these top 3 because these are things you must focus on as a currency trader. They have a direct effect on your success or failure.
If you need the basics such as charting information, brokers, or even Forex demo trading and other trading tools, you can download that information for free from this link.
Header
Have a trading strategy that has been tested and proven to have an edge in the markets.
Before we get going I want to mention something very important: There is no holy grail in Forex or any other market regardless of what the emails and marketing websites say! If your back test looks good on paper, remember that it is not an indication of future results.
By back testing, you are assuming that what showed a successful result in the past will do so in the future. Forward testing your trading strategy, where you trade inside of demo account with your Forex broker, can also help show if your strategy has a positive expectancy over time.
Please remember that live trading in the Forex market is much different than back testing. Do not be surprised if the results you get trading in a real trading account are different. It is vital that you have a trading plan that can help keep you following a rule set for every trade.
Focus on a Forex trading strategy that you can
Any system or method based on the mechanics behind price, does not totally rely on lagging trading indicators, and can be easily explained is something you may want to investigate further.
A trading strategy, regardless of the market you trade, should have the following three important questions answered:
Header
I am going to use a supply and demand trading example to explain what a trading setup is. Supply and demand is a technical analysis approach that also uses price action to find and enter a trade.
Technical analysis is a market analysis of the price action and structure on a chart such as support and resistance. The theory is that the markets tell a story and moves are repeatable. You can also look at analysis such as momentum and mean reversion to help with your strategy as you learn more about what can form a trade idea.
Supply and demand in this regard simply refer to the battle of the bulls, bears, and the imbalance caused by having one group being able to exert control over a market.
Header

This is an actual Forex trade setup and for this trading tip, I wanted to use one that was actually a profitable trade.
Header
The larger time frame for this chart was sitting at a supply level and our level here is right up against it. Buying into a supply level (or selling into a demand level) when right on top of it will generally be a hard trade to succeed with.
I want to draw your attention to the large green candle. It should be obvious that a large number of contracts were bought to drive price this fast and hard in a 30 minute period. The high represents the last buyer who then saw price plummet and take them into a losing trade.
Without a trading strategy, it’s easy to justify buying that large candlestick because it is showing momentum in the market. I would argue too much momentum but that is another topic.
With a trading strategy, you would not have been a buyer and this highlights why an actual trading strategy is paramount to your future as a trader.
The setup occurred when the price came into the zone we were watching.
In this trade, the trigger is actually price just coming into the zone. Let’s say that you need a little more confirmation and require an actual trigger to get you into the move.
Important: Confirmation can often require price moving in your direction which could increase your stop size thereby lowering your position size.
Header
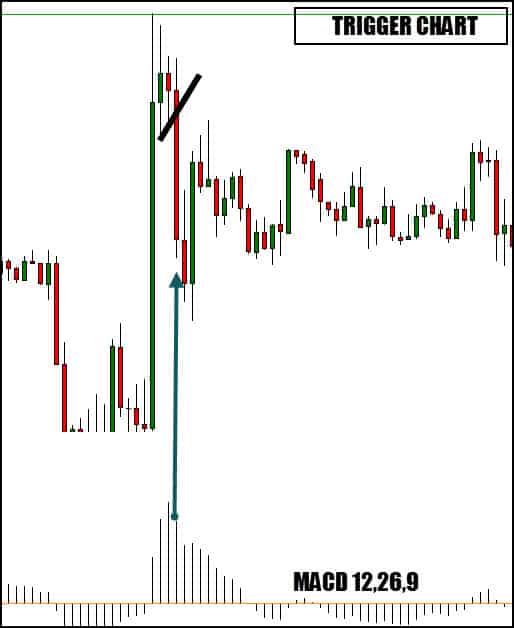
Two trade triggers can be seen on this chart. The MACD is a momentum indicator and when you see the histogram drop lower, you can use that for your trigger into the trade. This indicates that the upside momentum is starting to lessen.
This is NOT a holy grail trading entry (nothing is) but taking into consideration our trade setup and what it represents, it’s not a bad play.
We also have a mini-trend line connecting the lows of the candles and you may elect to simply short this market upon the break of that line.
Header
This chart has inside candlesticks and these same candlesticks don’t show with certainty whose in control. We can tell that momentum is slacking and given the nature of this setup, just shorting when the market shows weakness is also a viable trading decision.
This is not a complex trading method but has proven to be very effective and allows larger position sizes due to the “tight stop” for risk management that is usually used. It has both aspects that we need: a setup and a trigger.
The main drawback of this type of trading is people have an issue quantifying the setups. For those people, a trading system by Netpicks may be something to consider.
All the setups are mechanical with a little bit of art, which means when certain variables are met, you are informed of a trading opportunity. All targets, stops and entries are printed for you and that helps keep you consistent in your trading.
Here is a great video showing Forex trades using our very popular Counterpunch Trader that can be used on many currency pairs.
Header
Money management is not the most glamorous Forex topic but without a full understanding of risk and leverage, you run the risk of account ruin.
Nobody is able to tell you what risk to use per trade but the standard quote is usually 1-2% of your account balance. I will add two things to that.
This can be an in-depth topic with examples and “what ifs” however following two basic account management tips can go a long way in protecting your account from a string of losses and ending your Forex trading career.
Header
While the majority of traders simply use their account balance as a sign of success or failure, it does not go far enough pointing out where you can improve. It also doesn’t show you where the bleeding is happening with your trading.
A free software application is available called the Ultimate Trade Analyzer and you will see this software that you can download right now, is feature rich.
Header
Mechanical and automated trading have their pluses especially when you realize that trading psychology would not be an issue.
Stating the obvious – We are human.
We are all subject to emotions and doing things that we know are not good for us. We make excuses why we do things. For instance, taking a few losing trades and then seeing price bounce back, we decide to ignore the stop the next time we trade.
This one doesn’t come back and your account is drained.
This happens all the time!
Again, this is such a vast subject and there is no way to do it justice in a blog. However, what I am about to say was one of the most important Forex tips I ever received.
Why?
Because it encompasses so many things such as:
Header
This means that we don’t know if the next trade is going to be a profitable trade or whether price will hit our stop loss In fact, we don’t know if the next 3 or 5 trades will win or lose.
What we do know is that it will win or lose – we will have a result.
Can you see how understanding that basic fact makes it crazy to risk too much on the next trade?
You have to give yourself a fighting chance with every trading opportunity that presents itself.
Embrace not knowing and do everything that makes up smart trading on every single play.
In my opinion, how to trade Forex successfully means doing everything you are supposed to do on every trade.
Every trade, give yourself the goal to improve on every aspect of the three categories mentioned above. It is my hope that this assembly of Forex trading tips helps refocus you to act and think like a professional trader, whether you are an experienced trader or just starting.
Header
Header
Header
Best Automated Trading And Charting Software In 2018 For Forex
Forex trading software has evolved from simple broker charts and Forex trading robots all the way to Forex automation software that make it easy for anybody to enter the market and begin trading
Markets of all types have benefited from technology advances and the number of advancements in online trading can boggle the mind but we can break them down into the following categories:
Let’s break down each section and then wrap up with the attributes that you may want to consider when determining the best trading software for yourself.
Auto trading systems come with controversy. Many large firms use automated trading systems to enter and exit their positions but this is not the same type of automatic trading that is available to the average trader.
Keep in mind that these companies have millions of dollars they use for the design of their automatic trading software. They recruit the best minds with a wide range of expertise from top schools to research the markets and write the code. This code then optimizes itself over time depending on the recent past performance of the market.
Forex trading robots (expert advisors) attempted to capitalize on the success of automation however in the end, they have shown themselves to be a waste of money, a waste of time, and a quick end to trading accounts.
Header
Automated Forex trading robots are, for the most part, using over optimized technical analysis tools for trading decisions that fit past data and use tell you when to buy and sell.
Try using a robot on a demo account instead of a real account and you will see that the hype generally never equals reality.
High frequency trading software (HFT) has caused many issues with the markets prompting the SEC to begin an investigation. Exchanges are being looked at for potentially giving HFT traders an advantage over other traders in relation to the buy/sell orders.
It’s not all doom and gloom as there are Forex automated trading software programs that are designed by those who have a profitable trading system. They have simply chosen to automate their work and can allow a program to execute when their trading variables line up.
Header
Letting a software program determine your trading opportunities and even executing when a buy or sell signal appears has a few positives that may interest a Forex trader:
If you have traded for a while, you may have noticed the urge to do some things outside of your trading plan. These usually occur either after a losing trade(s) or after a string of winners where you feel invincible.
Header
Once the variables line up, the trade is executed and managed without your intervention. With your buy or sell signal being executed by the auto trading aspect of the software, you don’t have the fear of missing out on a trade.
The trade is allowed to play out to its conclusion and the win/loss becomes a random distribution of the method and not from your deviation of the trading plan.
Without allowing your judgement to come into play for your trading decisions, each trade is executed exactly as outlined in the trade plan. You allow the expectancy of your trading system to play out and if the expectancy is positive, you know in the long run, your trading software will serve up a healthy trading account for you.
When your automated Forex trading software is unleashed on a wide range of currency pairs, you will be hard pressed to miss a trading opportunity. Since Forex traders are looking to enter currency trades virtually around the clock, you can be assured that your automated trading software is waiting for trading opportunities regardless of the time of day.
There is a drawback however and that is being over exposed in the market. Trading software usually has a limit on the amount of capital exposure but if your does not, expect to find yourself in too many positions and in many cases, being long and short and just compounding losses.
Risk management is vital so you can reap the rewards of successful trades without blowing your trading account when the losing trades come.
Header
Not all Forex traders can code but if you can, this will allow traders to take their own successful trading strategy and automate it to either execute a trade or to send you a signal. There are also coders you can find on the web that may assist you with developing your automated program or you can learn it yourself
Let’s consider a simple trend following trading system for your automated Forex trading system that uses a moving average technical indicator for market sentiment and to enter/exit a trade
Your coding could simply include:
You would write the code for the strategy and run a back test to determine if the variables you have chosen had success in the past. The danger is over-optimizing the trading variables and while the automation looks promising, the future results are not as exciting.
You can watch this video for an example of a moving average crossover automated trading system and learn a little about custom programming. You can also read this article about building an automated trading strategy with Tradestation.
Header
In essence, you start with an idea to develop a trading strategy you want to automate, learn to write the code, and then back test to see if the past data shows any promise.
These are the currency charts where price is plotted and in some instances, you can enter and exit trades right from the charts (on-chart trading). Trading chart software can go from basic price and time plots to a whole range of information such as:
Header
The features available depend on a few variables however keep in mind that the more features, can mean a higher price for the charting software.
Many people, especially beginners in currency trading, would probably want the following features in the forex trading platforms they may be considering:
Since many begin their trading education by learning about technical analysis, indicators such as moving averages, oscillators and other trend determination tools may be useful.
Most platforms, including the free Metatrader download that is available even for mobile trading, comes with a vast array of technical analysis tools that may make up your particular trading system.
Header
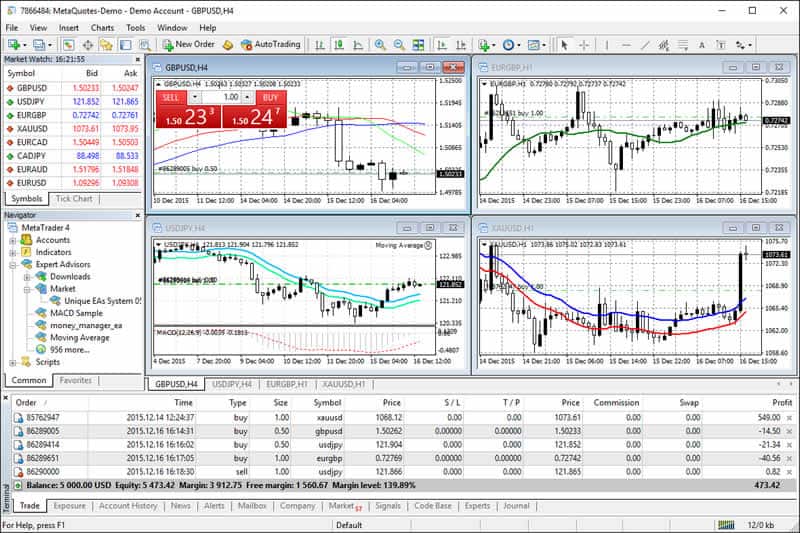
I find this useful because knowing at a glance where price is in relation to your stops or targets in real time make trade management extremely simple.
Some charting software programs will allow you, with a click of the mouse on the chart itself, to execute your trades without a separate piece of trading software.
You can also easily adjust your stops if trailing or adjust your take profit targets by simply pulling a horizontal line up or down on the chart itself.
Free Forex charting software from your trading broker does have drawbacks.
The market data feed usually comes direct from your broker and not an arms length third party. Since Forex is not a centralized exchange, there may be different price quotes between brokers.
Header
As well, software such as Metatrader provided to you from your broker usually has a wider spread value so in reality, it truly is not “free”.
Downloading your trading software is not the only option.
You can also get online Forex charts and one popular type are the charts from Trading View. These are not as sophisticated as the paid download platforms and may not be suitable for all investors and traders but for a simple trading style, they may be all you need.
Another benefit is there is a social trading aspect that comes with Trading View. This enables traders to see what other traders are consideringwhen they look at the charts. You can post your own thoughts and get comments on your charts.
This is a good trading for beginners tool that allows them to see if they are having the same thought process as other traders.
This type of Forex trading software is different from the automated trading software described above. These provide you with Forex signals for entry and exit levels and you are responsible in the execution.
Trading signal software can also encompass trading systems that you are available on the internet and this is a route some take to start trading.
This trading software allows you to trade currency using a a combination of variables and trade plans. Here are the general steps in swing and day trading software once you download from the vendor.
The key to this type of software for the foreign exchange trader is to ensure you back test the plan according to the trade plan that accompanies the system.
The benefits to the back test include:
Header
If you are new to this type of Forex software, you can see the benefits by downloading the free version of Netpicks own Trend Jumper. Simply download, install, and back test the system
Every trader is unique and some things will suit you while for another, it may not be appropriate. There is nothing better than trial and error and that is often the best way to learn. It would be prudent for you to download any Forex trading software you are considering and put it through your own style of testing.
There are a few points that each person should investigate during their testing phase.
There is nothing worse than trying to work through something yet not have the support to help you over the humps. If support is not existent now, don’t expect them to be there when you have real money on the line. Be a stickler for proper support.
To be fair, there are many low quality companies out there selling low quality products. Ensure there is a refund policy and make sure you read the fine print to make sure you fulfill the refund requirements.
That said, be a quality individual who doesn’t simply refund to get the trading software for free. If you are requesting the refund in good faith and there is no response, charge-back through your credit card company.
Header
Forex is one of the most hyped markets and many vendors with promote their Forex trading software with outlandish claims. Make sure that what they promise, they deliver. While results may differ, they should not be so far off the mark if you have followed the instruction they laid out. Forex robots were hyped to be an ATM but most, if not all, failed to deliver. Remember if it is too good to be true, it probably is.
Header
If you trade Forex, you don’t need anybody to tell you that many of the popular currency pairs are in conditions at this time that can be tough to trade.
Yes, you can emotionally trade and maybe get a winner, but for the past several weeks, finding great reasons to trade haven’t existed.
There’s been choppy price action, low volatility, momentum appearing and disappearing, and all of that combined does not make our job easier.
There is a tell-tale sign that conditions are not great and for that, we can look at the US Dollar Index.
For those of you that are unaware, the US dollar index measures the USD against a 6 other currencies. Inside that basket, the EURUSD makes up the bulk of the measure.
The top 3 currency pairs inside the basket are:
Those currency pairs are matched up against the USD and form the bulk of the trading activity that happens in Forex.
The Dollar Index is a good barometer of the strength or weakness of the USD against other currency pairs although the trade weighted Index, it could be argued, is more relevant to the true strength of the USD.
Adding the knowledge of the technical conditions of the Dollar Index can be part of your overall trading plan and help you assess which direction you wish to trade.
Header
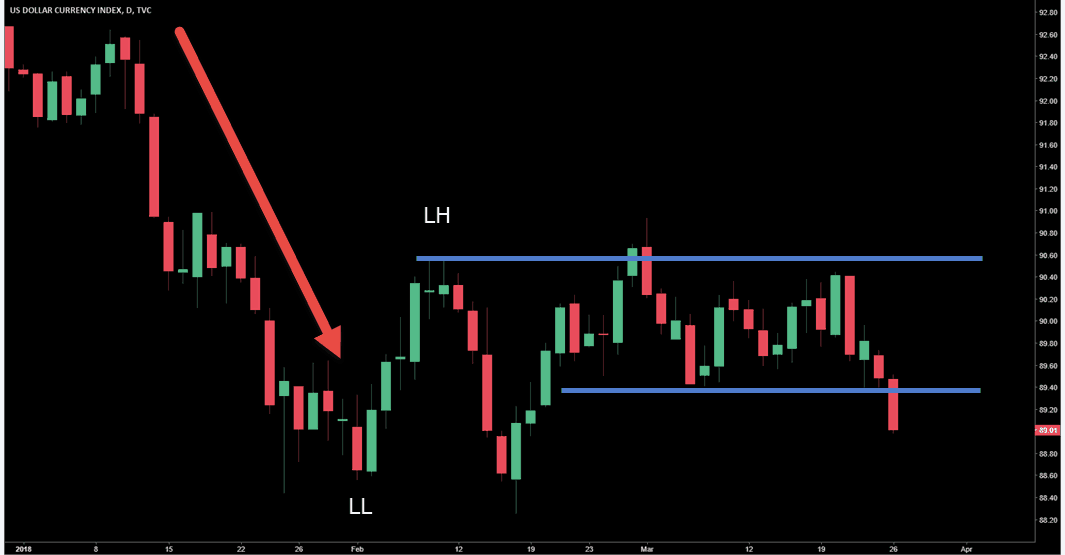
This the YTD US Dollar Index chart and we can see that in the beginning of the year, the USD was weak against the basket of currency pairs. Price action trend pattern is showing lower highs and lower lows. You can also see that any price consolidations resolved to the downside.
If you bring up the EURUSD or GBPUSD Forex charts, you will see that the drop in the USDX coincided with an up-trending market in those pairs. There were some great trading opportunities regardless of your approach – unless you were picking tops – and price was trending well.
Upside momentum stepped in showing the USD getting stronger as price began its rally.
If price would have kept moving, trading conditions would have continued to be fairly decent but markets are never affected by what we want.
If you are familiar with technical analysis, trending markets make a stair step pattern but as you can see in the Index, price sold off, failed to make a lower low, and got trapped between the extremes.
Header
This is when trading Forex (any market) becomes a little more difficult.

When higher time frames are trapped between two extremes, lower time frame chart usually have some trending moves that you can trade.
For longer time frame traders, like myself, while the first rally back to resistance was a good trade, the wheels came off of the market especially for those who focus on the trend.
The market is still in an uptrend mode on the higher time frames but the larger range with the range inside that range, made the price moves less “reliable”. Hindsight on this chart is easy but trading the hard right edge would not have been as smooth as “hypothetical”.
I don’t use much in the way of trading indicators but an intermediate term moving average can give you an indication of trading conditions.
Header

This is a 20 period EMA and the green star indicates when EURUSD put in a double top – not long after the USDX double bottom.
Price begins to whip around the moving average which indicates that price is in relative balance at this point. Markets that are in balance are tough to trade regardless of your trading experience.
While you can see the same thing with price action, using an indicator in this way allows you more objectivity and also helps you quickly scan charts worthy of your attention and risk.
If we take a look at the EURUSD with the 20 EMA applied, we see the same condition.
Header
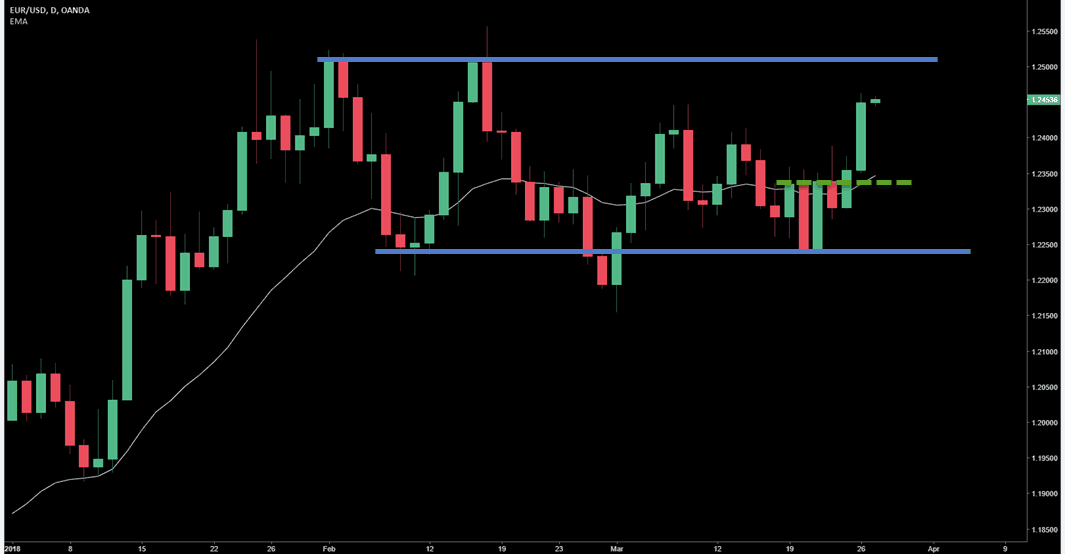
Looking at the USDX near the end of March, although we have seen some movement to the downside out of the smaller trading range, we still have lows less than $1 away. Does the recent strong move in various currencies mean the consolidation is over?
No.
Although I’ve been long the EURUSD since early March, I need to see price acceptance during the smaller range breakout. After that, 1.2550 zone is in the cross-hairs and you’d certainly want to see signs that buyers are back in control.
When markets are in consolidation, sudden momentum bursts are not uncommon and often times price will simply fall back into the trading range. We can never know with 100% certainty what the markets will do.
We can plan for different outcomes and react when price reaches zones that may be considered a tipping point – such as the high or low of a trading range
Combining the resolution of the EURUSD, GBPUSD, and USDJPY with the resolution of the Dollar Index gives you a double whammy approach to trading the top 3 crosses.
Header
Header
The multiple time frame analysis technique is something that I am sure many traders have heard of. Whether it’s the structured Triple Screen Trading method or simply looking at a time frame 4x higher than your trading chart, this analysis can assist you in a trade decision.
One thing that confused many traders is using multiple time frame analysis in terms of trend. “Trade in the direction of the higher time frame trend” is something that we’ve all heard from the day we began trading. I personally don’t use that methodology by taking a quick look at a trend indicator or general price movement but attempt to gain more information from the higher time frame.
The best way to explain one way I use multiple time frame analysis is to look at a current trade that I have taken in the CHFJPY Forex pair. Whether it works or not is not the issue because it will be a success because I followed my trading strategy.
Judging your trading on results is a losing proposition considering that regardless of your trading system, you will take multiple losses in a row and the expectancy research you have done will show that.
Basing your failure or success on properly implementing your edge, whether its multiple time frame trading as I do or single chart analysis, is much more productive.
This is the daily chart which is the chart I generally look at for setups during my analysis and is the first chart in my multiple time frame analysis that I want to talk about.
Header
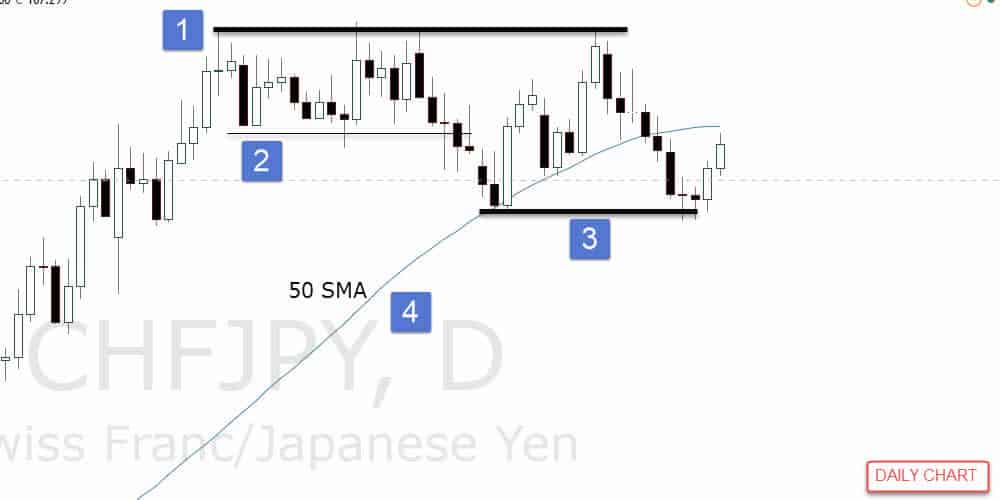
1. Triple top formation is certainly bearish but what’s interesting is the bears where not able to push price a great distance.
2. Was temporary support but even the break of that, as indicated by the candlesticks, doesn’t convince me that there is a lopside battle going on at this point.
3. Strong push into this zone was halted.
4. Not used by me but added for those that use it, this is the 50 SMA which would disallow long trades as you wait for a pullback
My trade is a long trade but I will quickly add that it I was not trading support. I do trade support “bounces” but there are certain patterns I will look for in these locations.
Overall, this daily chart is a mess and qualifies as a range bound market at this point however it hides a common trading tool. Perspective is given through a higher time frame analysis on this pair.
Header
The weekly chart highlights how strong this up move really was in the CHFJPY. If you were to an put oversold/overbought indicator on the chart it would indicate that this market is overbought. The general rule is to stand aside and anticipate a reversal in price.
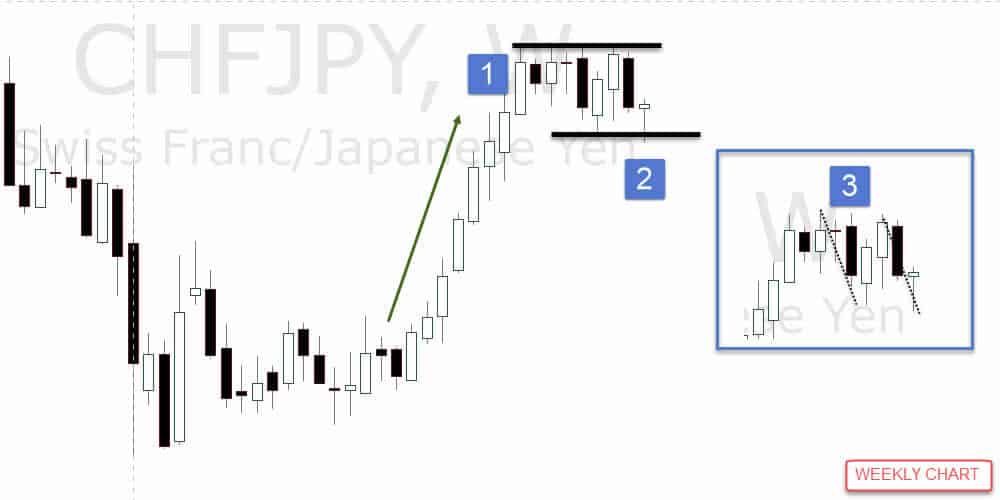
What the indicator doesn’t tell you is that even after a move like this, a consolidation can actually work off the overbought (oversold) condition. A big retrace in price is not written in the cards during these conditions. Something the textbooks don’t teach.
Header
Taking everything from the multiple time frame analysis into context, I could build a case for taking a long trade. Again, this is not simply seeing a support zone (although it could not be called support until after price rejected during the second visit).
While the daily is pretty messy, the weekly chart smooths everything out. A strong bull market emerged and continued for the last 8 weeks. Indicators will show overbought and price has gone into a consolidation at the highs of the move.
The consolidation is trading 1-1 as in both pushes in price are equal and price had broken a zone of potential support and snapped back inside. This tells me the bears are not strong enough at this point.
I dropped back to the daily chart for the trade entry. You can see in the chart below it was a buy stop above the candlestick that helped build that failure test on the weekly chart. I used an ATR stop that was entered when the trade triggered.
Once price went in my favor, at end of day I cut the risk virtually in half and the stop is sitting at the low of the day.
Header
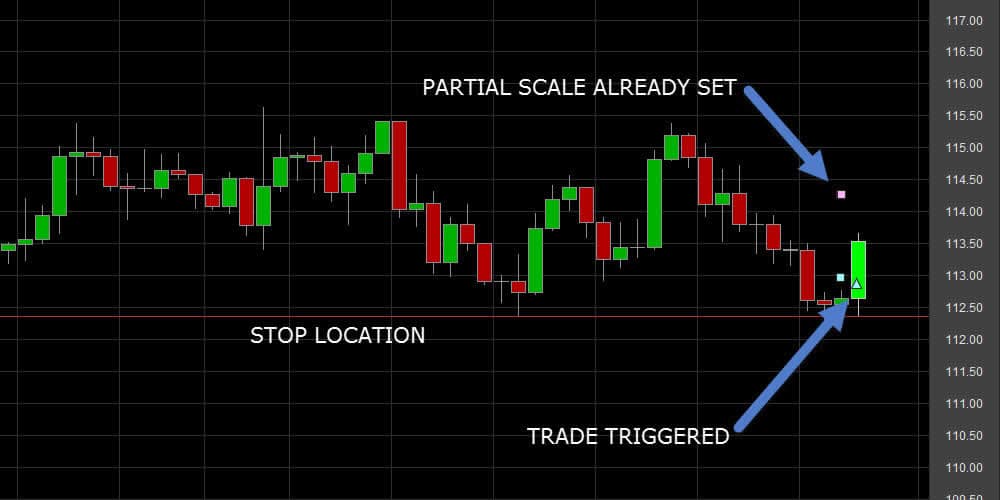
Some traders may be surprised that the current stop location was not the initial location. The fact is that too many traders use tight stops so they can have a larger position size.
That’s the wrong way to set your stop and you are sitting ducks for stop runs. That said, if I am triggered into a trade and there is a strong momentum move against me, I won’t wait for my stop to get hit. When you enter a trade, especially on the back of multiple time frame analysis that leans in one direction, strong moves against you point to trade failure, not success.
My initial stop is far enough away for wiggle room and to allow a triggered trade to mature. Once there is a push in my direction, if price returns to the base of the thrust, that’s not a good sign. I will take a loss but it will be much smaller than the one I planned for.
Multiple time frame trading is a great addition to any trading strategy. Try it out, test it, and see if it doesn’t tilt the odds further in your direction.
Header
It’s our goal at NetPicks to provide you readers with the best information on day trading and forex you can get.
NetPicks is the leader in day trading education systems and strategies, and an outstanding resource for quality articles, webinars, videos, and more.
But we want to make sure that you know where you can find even more news, analysis and opinion about Forex online.
So in no particular order, here are what we think are the top 6 forex websites that you should know about to supplement your Forex knowledge online.
 Check out Forex Factory if you want to know how the latest news releases are going to affect your trading session. Forex Factory provides the key news releases and indicators that will have an impact on your forex trading session, using a color coded system that shows how severe the news situation is. In addition, Forex Factory boasts a robust forum covering all aspects of trading.
 What does it mean to “cover an approach?” The definition of spread? Investopedia knows the answer and provides a comprehensive dictionary of the key terms and trading vocabulary that will prepare you for your trading session. If you’re in a pinch and need to look up anything involving forex or day trading, I guarantee you’ll find it here.
Header
 Forex newbies pay attention! Babypips is the go-to primer for beginning forex traders. Babypips breaks down the fundamentals of forex into an easy to learn free training course. They have a host of columns covering all things from psychology, automation, and first time trading in a perspective that is accessible to new traders. If you’re new to forex, or know somebody interested in learning, they belong here.
 DailyFX is forex broker FXCM’s free daily news site. It is a great source for up-to-the-minute market news and technical and fundamental analysis. It provides an economic calendar of major news releases along with free forex charts, and it has a forum where you can discuss your trades with other traders.
 Foreign exchange rates change all the time, so make sure you’re up to date on the currency pairs you’re trading with RatesFX. RatesFX provides foreign exchange rate data on all currency pairs. It is a comprehensive source for daily exchange rates with performance information, currency conversion, key cross rates, and an exchange rate alarm to notify you of key signals.
Header
 Trading can be lonely. Find community, friends, peers, groups in your area trading the same things you are. Traders Laboratory is a forex forum where you can find traders from around the world discussing all topics related to the financial markets. Contribute your own trading experiences, help out your fellow traders, and get real feedback from real traders with Traders Laboratory. Whether you’re looking for specific technical analysis tips, or locking down a bad trading habit, the community at Traders Laboratory will have a topic, opinion, and answer for you.
Header
Unlike the traders of yesteryear, today’s market participants have a huge selection of Forex trading tools at their disposal. As a matter of fact, the selection can be overwhelming at times so it’s important to dial it down to simple categories and decide what fits your needs.
The only way you’ll know what trading tools you need is to know what kind of Forex trader you are.
Swing traders may require different tools than traders who scalp or day trade the currency market. Let’s drill into four categories of trading tools that you may want to investigate as part of your Forex trading business.
The most obvious place to start is with the charting software you’ll need to chart the various currency pairs you may be trading. Your choices range from the charting packages offered by your broker, to the famous (and free) Metatrader package, and all the way to paid charts such as Sierra, Ninja Trader, and Tradestation.

Metatrader is very popular with the retail Forex trading crowd and EXTREMELY popular with those that sell Expert Advisors that trade for you. Think of “cheap algorithm trading” and you will know what I mean. (something I suggest you stay away from).
Everyone will have different needs and different budgets.
Header
You must test drive each platform you are interested in and see how it responds. One big thing for me is watching computer load and I can say that so far, I’ve found Sierra charting takes very low resources on my computer to run. While the charts are important, you also want to keep in mind who is supplying your data.
For retail Forex, your broker is generally the market maker and will supply you with the quotes and data and that may cause you concern. I’ve seen spikes in the broker data that did not appear when using an outside data source. Each charting package for Forex trading will come with many technical indicators and some will come with built in scanners as well as the ability to trade from the chart.
Again, everyone will have different needs so make sure you read the list of what’s available for the charts you are interested in.
Here are some of the highlights of Sierra charting:
Forex is currency trading and currencies are impacted greatly by the actions of the countries related to the currencies you are trading. Due to the impact news can have on currencies, the second trading tool is economic news reporting.
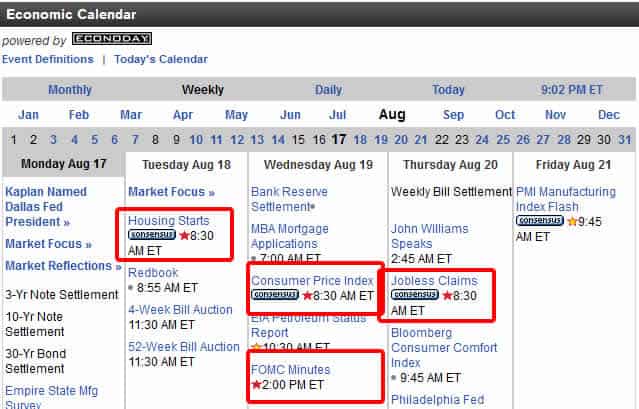
A calendar listing the days news events is something every Forex traders should be looking at for every trading session. This is very important for traders who day trade or scalp the currencies. Swing traders, depending on their style, aren’t really concerned with the volatility that can come with an individual news release.
Header
One of the most important releases you should be aware of is called: FOMC: The Federal Open Market Committee The FOMC meets eight times per year to set key interest rates, such as the discount rate, and to decide whether to increase or decrease the money supply, which the Fed does by buying and selling government securities. – Investopedia
Another release you should be aware of is: NFP: Non-Farm payroll In general, increases in employment means both that businesses are hiring which means they are growing and that those newly employed people have money to spend on goods and services, further fueling growth. The opposite of this is true for decreases in employment. – Investopedia
You can see on this segment below how the releases are listed on the Bloomberg calendar. I’ve boxed in the important releases and you can see they have a red star beside them. This indicates that these releases have the potential to move the market. Be very aware of these releases and a general rule at Netpicks is not to be taking a trade five minutes before the news.
Header
Technical analysis is described as: a security analysis methodology for forecasting the direction of prices through the study of past market data, primarily price and volume – Wikipedia Traders utilize technical indicator tools to assess the opportunities that fall under their trade plan for taking a trade in Forex.
There are drawbacks that come with using trading indicators but most of them come with how traders use them. Indicators are not the “holy grail” nor do they have an “uncanny ability” to predict the next market move.
They are a tool that can have a place in a well thought out and tested trading plan. Traders will find they have favorite indicators they like to use which is important because you are able to expertly apply them due to the amount of time you use them. You must become an expert at whatever trading tool you use and any market including Forex, is not exempt.
Let’s look at one very popular indicator known as Trend Lines. One of the oldest indicators around and are used to not only to determine trend, but also strength of trend and can even be used for entry into a trade.
Number one is the bottom trend line, number two is a copy of number one applied to the top and forming a channel. You can see how price is bouncing off both sides of the channel.
Header
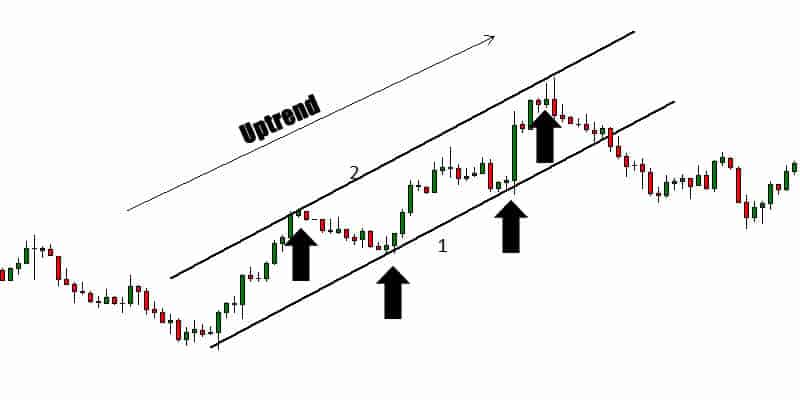
Drawing trend lines is straightforward. You simply connect two or more higher swing lows in an uptrend and lower swing highs in a downtrend as you can see in the chart above. I find trend lines to be powerful and can set up some very good channel trades where you short the top and buy at the bottom. Of course you need a trade plan for this but start experimenting with trend lines if you are new to them.
One thing that gets missed when talking about trading tools is the “paperwork” behind the scenes. You must have a way to journal in your trading business. You must know if you are slowly bleeding your account dry or if you are trading in a manner that will see you slowly compounding your account.
Header
Netpicks understands the importance of trade logs and is providing you with a free Capital Growth Application.
Using and understanding these categories of trading tools is the easy part. The hard part comes not only when you try to design a trading system or plan but also trying to stick to what you’ve tested shows an edge. One of the best ways to stay on track is being part of a bigger group of traders who care about your success.
Trading is tough…period.
Any edge you can gain, including surrounding yourself with those fighting the same issues, is well worth having in your corner. Forex trading tools are not just what you use to help you enter and exit trades.
Header
You’ll find that although there’s plenty of opportunity to spend money for trading services or “special indicators” , free Forex trading tools are some of the most useful that you will find during your online search.
For the most part, the trick is to know what you’re looking for.
Plus it’s also important to realize that although many websites offer a number of tools in one place, you’ll find that you might tend to prefer certain sites that feature specific Forex trading systems or specific features that may suit your trading style.
You must know what news releases are upcoming. There are many that can cause the volatility in the markets to spike and you do not want to be taken out of a trade because of lack of information.
You’ll probably start with something like an economic calendar and many seem to gravitate to Forexfactory perhaps as they offer a substantial forum-based community.
But for FX calendars, I prefer Dailyfx. They also have tools and commentary available on their website.
But perhaps the most substantial free economic calendar for forex traders supplied by Investing. It is highly customizable with 85 different countries in the filter section along with the type of release and relative level of importance.
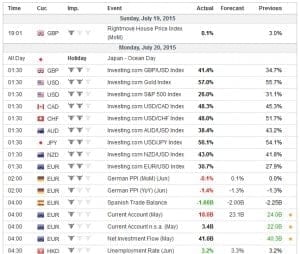 Forex News
Header
There are a great number of mainstream free FX news sources online. Marketwatch and Bloombergfor example.
But these on their own are just not substantial enough when minutes and even seconds can sometimes make a big difference to your P/L.
This is why I like financialjuice – a free financial news source aggregator that allows you to filter for your specific areas of interest and alerts you in real-time.
forexlive is also a fantastic site for current market information, order price levels and trade ideas.
But personally, the one critical news source to me as a day trader is a live news squawk. I like the one provided by talking-forex as it keeps me up-to-date with all the current market moving information as it happens and gets me the economic figure releases in real-time.
At £20 per month, it’s an absolute snip.
But if you don’t need the data quite as quickly as this, you can get a delayed version for free over at zerohedge – zerohedge.talking-forex.com.
There are a good number of sites out there that offer live, real-time forex charts for free. One that I like a lot though is Tradingview.
Their charts are high quality, feature-rich and run in any browser using html5.
Because they are also cloud-based, their servers do the “heavy lifting” reducing the need for high-powered trading systems. They also have a fantastic chart/idea sharing facility where you can view other traders’ analyses.
Both fxstreet and forexticket have some useful tools too – pivot point calculators, FX volatility, correlation and more. Plus they also have great sections on current forex analysis.
Another great tool is the currency heatmap offered over at oanda and although it’s primarily for stocks, finviz also offers some great fx heatmaps
Header

Although there are some fantastic courses available for a fee (including at Netpicks) there are some great free trading resources to get you started (or brush up).
There’s some great information over at www.babypips.com but why not try our free beginner’s guide to forex too! – Forex123.
There’s a vast number of free forex trading tools available online, but not all are particularly useful. Hopefully some of the resources I’ve highlighted will be useful to you and save you some of your valuable time.