Preview your profit and loss using free Options Trading Software

 Using different pieces of options trading software makes trading so much easier now than even a few years ago.
One of the biggest complaints that I hear from traders is that they don't understand what makes an options price move.
For most, options are these complex products which have numerous factors that can influence their price.
As a result, many newer options traders place trades without ever knowing what kinds of returns to expect.
Option Price Movement
Options rarely move on a dollar for dollar basis with the stock. The only time that happens is when you are trading very deep in the money options.
In all other cases options move at a percentage of the stock movement.
So how do we know what kind of P/L to expect out of our trades?
Fortunately for us there are some neat pieces of options trading software that can help us form expectations for our trades.
First of all, it is absolutely essential to have an options trading strategy in place before ever taking a trade. You really need to have a set of mechanics that tells you when to get in and out of a trade.
If that is done by using technical indicators on a chart or by looking for certain levels of implied volatility that is fine either way.
Once you have your system in place, it can be very beneficial to use a piece of options trading software to predict what your P/L will be on each trade.
I like to use the Thinkorswim software for my trading because of all the advanced tools that they offer. One of those tools is located on the trade page.
I like to add the Theoretical Price column to this trade page. This allows me to preview the changes in the price of the option that I am looking to buy by changing the price of the stock or Implied Volatility.
Tesla Short Example
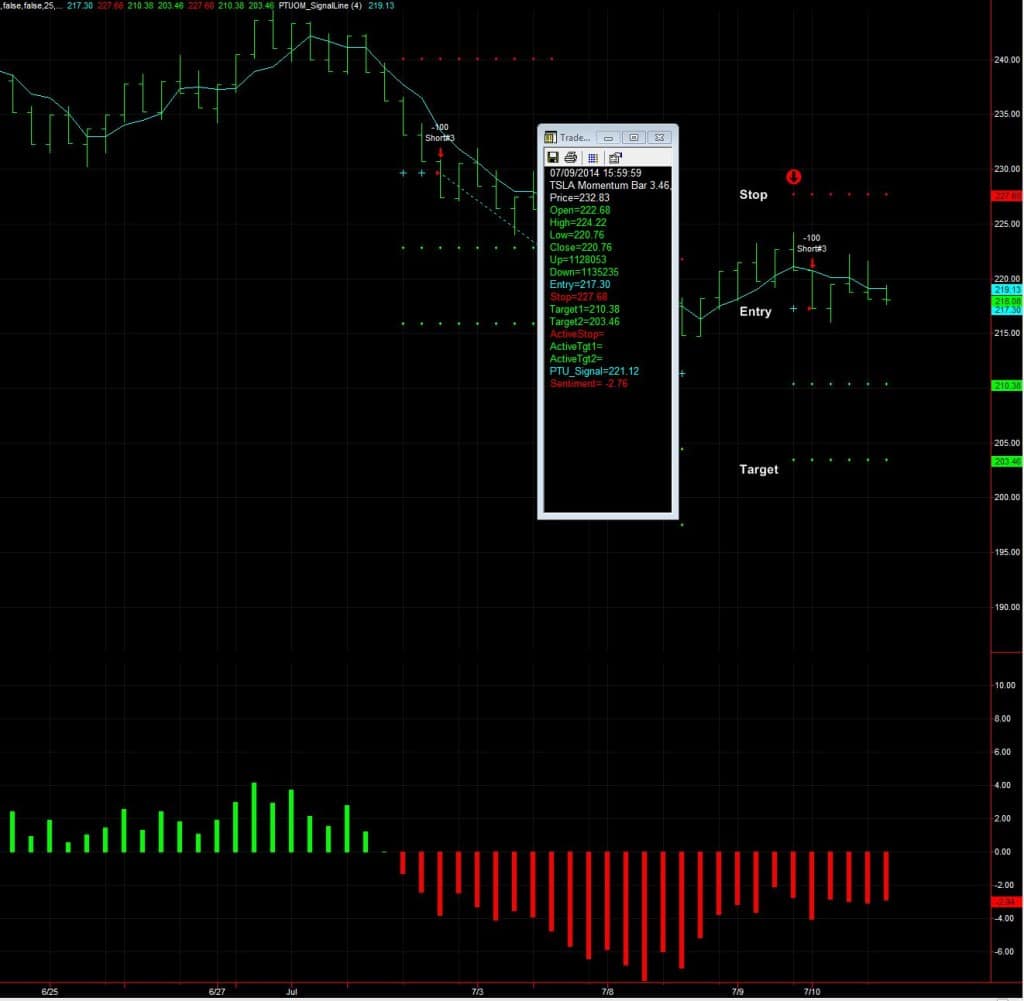
For example, my Options Mastery students were triggered into a TSLA short trade last week with an entry at $217.30.
Our target was calculated to be at $203.46 and the stop at $227.68.
These levels were calculated for us using the Active Swing Trader calculator (click on picture below to enlarge).
We decided to go with the July weekly 220 put option at $7.60 when placing this trade. This gave us control of 100 shares of TSLA at $220 per share for the next 2 weeks and we paid $760 per contract.
We knew where our stop and targets were at so we decided to use the Thinkorswim options trading software to help us predict what our profit or loss would be.
Click Here to play a short video walking you through
how to setup the Theoretical Price column in Thinkorswim
To predict what our profit would be we went back to the trade page and used the Theoretical Price column.
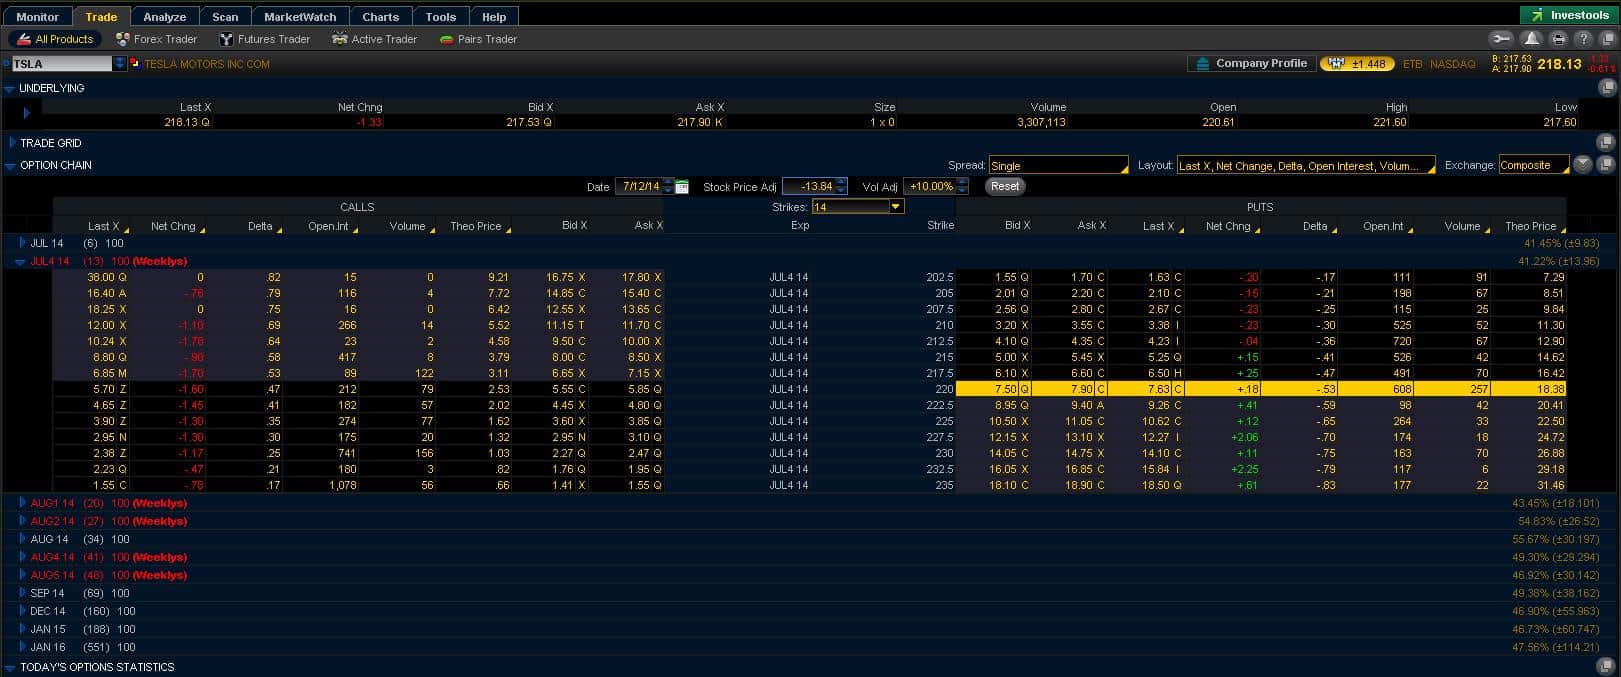
On the trade page there are tools that allow us to make a Stock Price adjustment and also a Volatility adjustment. We know from our Active Swing Trader charts that our target is at $203.46 or a $13.84 drop in the stock.
We went to the Stock Price adjustment box and typed this price change in (-13.84). We can see that if the stock drops by $13.84 like we expect then the July weekly 220 put that we bought would increase in value to $17.26.
That would give us a $966 profit on our puts or a 120% return on our money.
Let's take it a step further and say that during this move lower in the stock price of TSLA that volatility also increased by 10%.
Now we can see from the Theoretical Price column that the 220 put option that we purchased would be worth $18.38. This would increase our profit to $1078 per contract.
So now by using these tools we have a rough idea of what could happen to our put option if the target is hit (click on image below to enlarge).
We can also take a look at what would happen if our stop is hit.
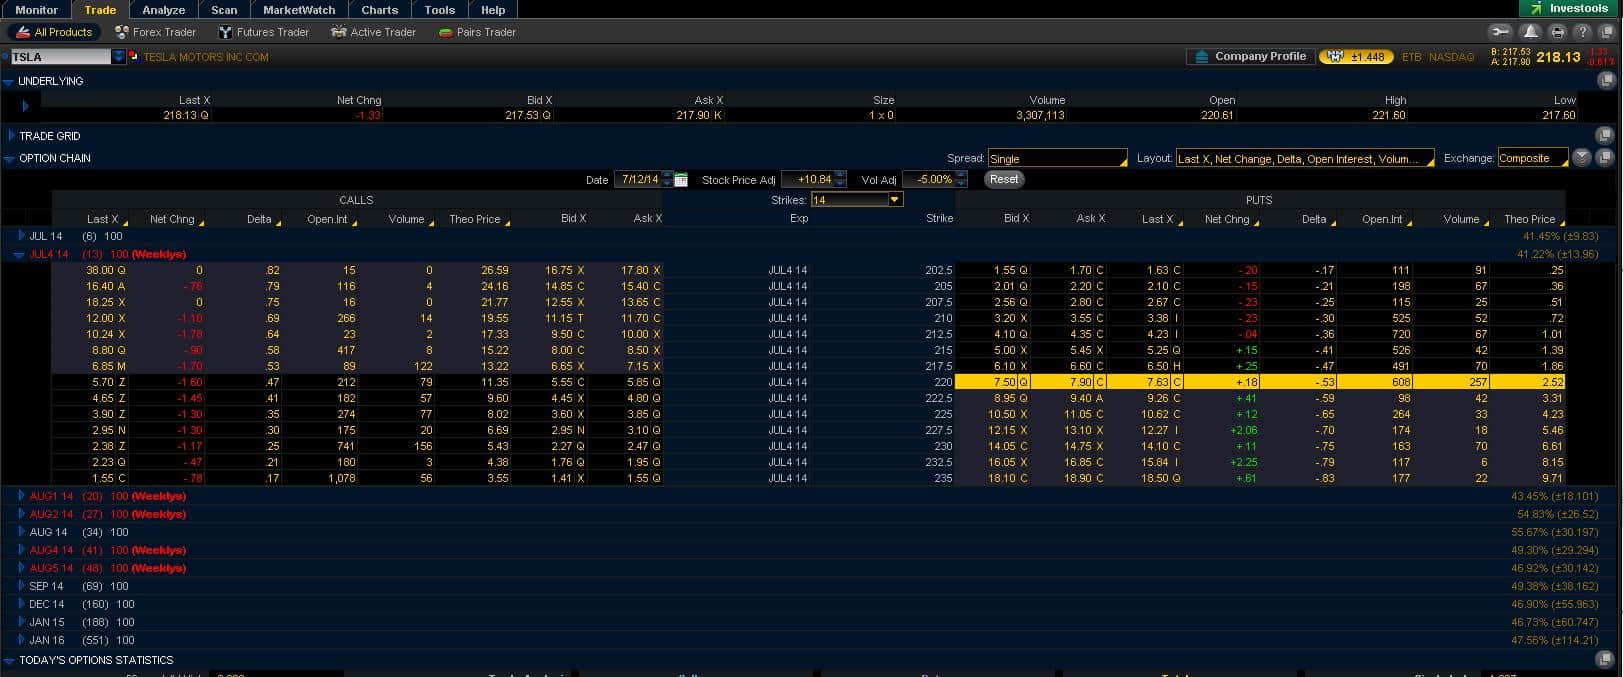
We can use the same Theoretical Price tool in Thinkorswim to adjust the stock price up to our stop level which is at $227.68. This would be a $10.38 rally in the stock which we will type into the Stock Price adjustment box.
If the stock rallies against us then we are looking at the 220 put option dropping to $3.41 which would give us a $419 loss on the trade.
If volatility also dropped 5% we can type that into the Volatility adjustment box to see that the 220 put would drop to $2.65. This would bring our loss on the trade to $495 (click on image below to enlarge).
Options Trading Software
So now by using a very simple but yet powerful piece of options trading software we already have a much clearer idea of what we might expect on this trade that we've just entered. We know what our maximum loss and gain could look like if either the stop or target is hit.
This tool doesn't guarantee success but it does help us to manage risk.
It really helps in determining what type of position size I can put on the trade. Just another tool that can be used to increase your overall profit and loss and to help you become more consistent with your trading.

