Learn A Simple Range Trading Strategy
It's been said that a market only trends 30% of the time.
I can't quantify that figure but having a range trading strategy to take advantage of the other 70% is good business.
Range trading is not difficult however it does require discipline and a method of determining when a trading range is in play.
What Is Range Trading
When a market is trending, you will see a stair stepping pattern of higher highs and higher lows in the case of an uptrend. There is an imbalance of buyers and sellers and you can generally see the difference between an impulse move and a corrective move.
Impulse moves are stronger and bigger in scope than a corrective move. 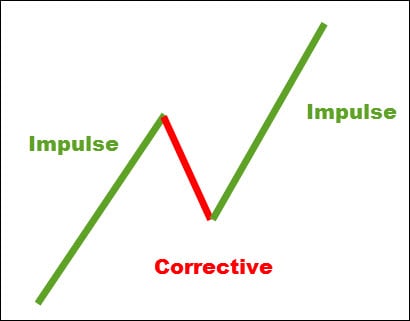
Once that condition stops, markets tend to find themselves stuck between a high and a low and continue to oscillate between these two points.
Buyers and sellers have found a point of relative equilibrium and you can find yourself in a very choppy environment if attempting to trade between the extremes.
This is when traders will place trades against the high/low extremes and will continue until price breaks out of either side.
We've just come to the first issue with range trading and that is finding the two points that will act as potential support and resistance levels to trade against.
I did a piece on support and resistance where I blanked out the chart and randomly laid on some horizontal lines. Turning the price bars back on, price found both support and resistance on every single line.
Related - Do You Textbook Trade Support & Resistance
Of course, that does not discount the validity of S/R but it does bring home the fact that price can and will bounce seemingly from a random level on the chart.
To ensure you are using a level that may have some importance, levels that are obvious would be a better place to watch for price action and potential trading opportunities.

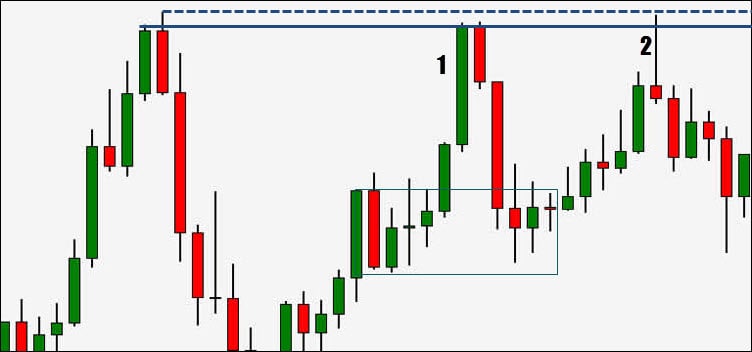
This instrument is trending down and puts in an obvious low at #1. For the down trend to continue, you would need to see this low taken out to continue our pattern of lower highs and lower lows.
Price rallies and when the price starts to drop, we have our high at #2. The issue is a potential pivot at #3 and is confirmed when the price at #4 takes out the #2 high.
Has this market gone right from a down trend to an up trend?
No.
You will later see that price falls back and takes out the #3 low and you can clearly see that price is not in a trending pattern.
You have the extremes of our range labelled as #1 and #2 but #4 highlights an important fact about these levels.
They are not a defined price.
When looking at these turns, consider them to be zones with a margin of error both outside and inside the range.
Range trading will take into account both extreme zones and a trader will look to position a trade against the potential zones of support and resistance that form the range.
Why potential support/resistance?
You don't know what will happen when price returns to those extreme zones.
- It could stop.
- It could reverse.
- It could breakout.
These zones potentially have an effect on price and keeping that word in mind will keep your expectations in check when confronted with the meeting of price and zone.
It will stop you from simply pushing the buttons and taking a trade and will force you to look for signs of what the probable move may be.
Trading Range = Consolidation
When trading trends, most people are used to the impulse and corrective swings in the market. These pullbacks/rallies are continuation patterns of the overall trend.
The same thing can be said about trading ranges.
More often than not, a range is a price consolidation as part of the overall trend move. It certainly can be the ending of the current trend and a reversal is imminent but that
has to prove itself and not to be assumed.
4 phases of a market are accumulation, mark up, distribution, and mark down. It is possible that the consolidation you are looking at is either accumulation/distribution. Let it prove itself to be a trend change or show a clue such as higher time frame divergence but assume a continuation play if trading the smaller time frame.
Ranges can also occur when the higher time frame becomes overextended and the range is where that condition is being worked off.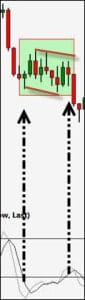
The first chart shows a range on the daily chart that occurred after 148 days of an overall down trend in the market and 27 days of an impulse leg that terminated at the #1 low.
This chart shows the weekly chart of the same point in time.
You can see that price had two weeks of a momentum push to the downside and our indicator shows an oversold state.
Our daily range played out for 63 days but a quick look at the larger time frame showed an extended and oversold market but the lower highs/lows, lack of divergence, and lack of reversal price action pointed towards a trend continuation and not a reversal.
Risks Of Range Trading
There are a few issues with trading the range but many of them can be avoided if the trader is disciplined in their trading approach and knows what to look for.
Having a read on price action will also go a long way in helping you take advantage of the opportunities that range trading provides.
Runs to the range extremes
You've probably heard it said that the more times something is tested, the stronger it becomes. "Look for multiple touches to confirm strength".
No.
I go on the opposite premise that multiple runs to a level weakens it, not strengthens. If a price level is important enough to reject price, why should it continue to revisit that area multiple times?
If it is going to revisit multiple times, I would also expect to see the move away getting stronger and not weaker to indicate strong interest at the extreme.
I also look at the number of times traders take positions against the extreme and place their stops just on the other side. If that breaks, especially in the direction of the higher time frame trend, a protective stop cascade could propel price hard, fast, and when those protective stop orders get hit and turn to market orders, how much slippage is going to occur?
The point is not to blindly take a position simply because the price has moved to an area from the past especially after multiple hits at the extreme. Remember that markets cycle through ranges and trends so eventually, one of the extremes will break.
If you want to fade the extremes, you want to see some type of failure or signs of a reversal at the extremes.
Related - Profit From The Failure
On the other side of the coin, you don't want to assume you are going to have a trading range breakout simply because price moves strongly towards an extreme.
This chart shows a range and at #1, you can see the strength in the candle as price pushes towards a potential resistance area. You know people bought into this move and the small upper shadow shows a very small number of sellers.
Just as strongly as price advanced, it collapsed and once it was obvious the range breakout was not going to happen, a large momentum candle shows up that could indicate the buyers exiting their positions. It could also indicate that those who bought at the small consolidation or at the support extreme, are taking their profits.
Regardless, anticipating the trading range breakout served up a healthy amount of losers.
Price advances once again to the potential zone of resistance and price action at #2 shows the imbalance of sellers and buyers at the extreme that could be used for a trade entry. This is a picture perfect reversal although it was not a strong continuation away.
You wouldn't know that of course and that is why trade management must be part of any range/trend trading strategy.
If you are looking to fade either extreme, this next chart shows the type of action you do not want to see. It's not a perfect example but understanding what is happening is important.
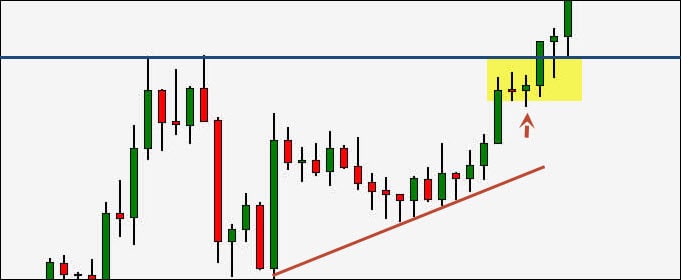
The extreme has been in place for a while and has seen multiple reversals in the area. This last one is different. The reversal on the left had signs of indecision until sellers took over. The last push up has consolidation right at the extreme and there does not appear to have much of a bull/bear battle taking place. You can also see part of the uptrend pattern of higher lows taking place.
We do not want to see a pattern of higher lows into the resistance extreme nor lower highs into the support extreme.
We do not want to see accumulation at either extreme.
While a reversal could still happen, this type of price action and structure at the extreme does not give much confidence for shorts (longs). If anything, some traders may find an entry inside of the consolidation at the failure test candle marked with the arrow.
Expanding trading ranges
When you see price breakout out of both extremes and failing to trend, plus each swing is larger than the previous you get a range that is expanding.
These are not something I want to take part in as the market has no clear cut consensus on what it wants to do.
Also, if taking a position in this type of environment, where would you put your stop?
Being unable to define the stop on the trade can interfere with your risk profile for your trading plan.
Keep in mind that a simple breach of either extreme does not invalidate the range as the range could simply be expanding to a larger size.
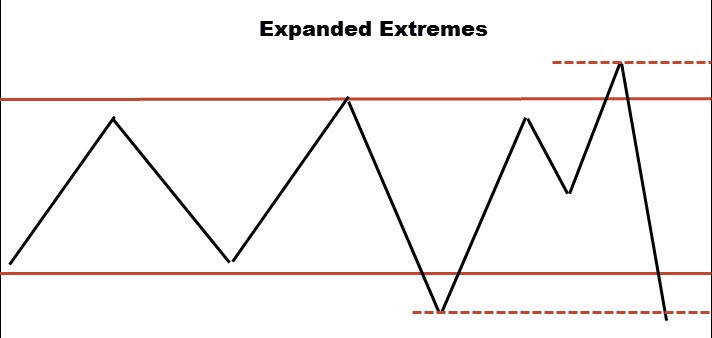
This is quite different than erratic swings in each direction and while it may turn into an erratic expansion, at this point we can still find positions.
Converging range
While there are different names for each chart pattern, I keep it simple and if the market is not in a trending state, I call it simply a range bound market.
This is the opposite of the expanding range and here price appears to zero in on a particular price point. Compression is occurring and generally, a trader will look to position themselves in the breakout of the move when it occurs.
Noting there is compression is important because when it breaks, there could be a strong move behind it. Given that, looking to fade breaks of these types of compression ranges is probably not a wise trading plan.
Why Range Trading Works
We covered a few things to look for when trading ranges including not assuming the range will hold and looking for a sign that a fade of the range extreme is the right play.
You also noted that a range can take various forms and some are easier to get a handle on than others.
Seeing a market in an expanding range would probably take that market off my list of tradeable instruments.
The converging range would have a breakout play in mind and while some will still fade the extremes, it doesn't suit my plan.
I actually don't know of anybody who trades inside the converging range.
While there may be some, looking to position in a breakout in the direction price was headed prior to the range seems to be the most common play.
Let's cover why range trading works as a viable trading method.
Once a range has formed and you have determined where the extreme zones are, you now know exactly where you are to look for a trading opportunity. There's no guesswork involved. Price will either break out of the extremes, reverse at the extremes, or expand at the extremes.
The middle of the range is not an area you want to play in.
Support and resistance levels (remember you are looking for obvious ones) make up the extremes of the range and S/R are zones that garner a lot of trader interest. You will have some type of action around these levels that can range from a clean test of the level to price whipping around the zone.
The key is to have a trading strategy that sets up what you are looking for and how you are going to trade it.
- What type of price rejection are you looking for?
- Where will you place your stop?
- Will you use other tools to help in your decision?
Just remember that ranges end and a trend will begin. Before that happens, taking trades while in a trading range can offer up another opportunity for those looking to make money in the markets.
Using Range Trading Indicators
Trading indicators can aid in your decisions and when trading ranges, oscillators can have a place as part of a trading plan. Let's look at the slow stochastic trading indicator as a tool you can use when looking to trade the extremes of the range.
The extremes are marked by the circles but you can see later that the top gets exceeded in a breakout failure type of action.
Related - 3 Of My Favorite Trading Indicators
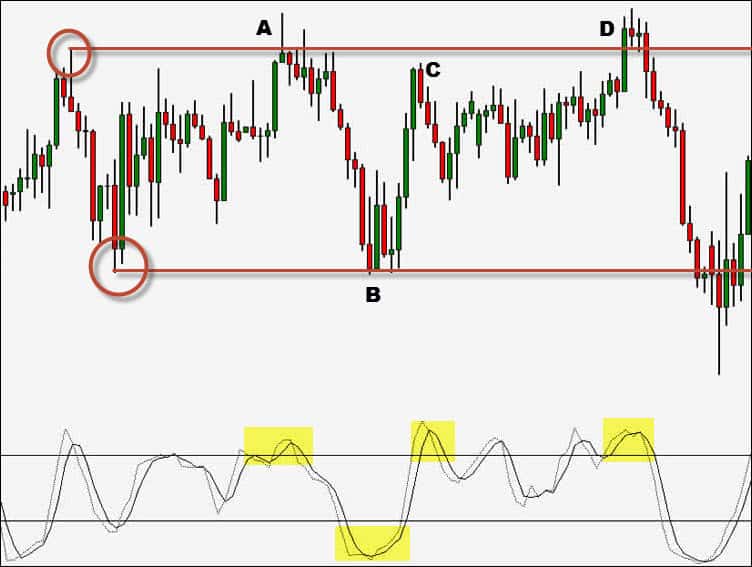
At "A", price pushes into the extreme and sets up a reversal candle. The indicator plots into the overbought area (not a signal by itself) and you have a shift in momentum which is shown by the cross of the indicator lines. It's a combination of each event that may/may not constitute a trade.
Price drops to the lower extreme at "B" and you get an engulfing candle, an oversold indicator plus a momentum line cross.
Is "C" close enough to the new extreme put in at "A"?
Is there a reversal type of candle pattern?
Is there a slowing of momentum seen in price?
Besides the indicator position, I don't see much enticing with this trade especially since price action did not show any sign of a potential reversal.
Finally, at "D" price pushes to the new extreme, shows weakness while the indicator is overbought and you see a momentum line cross.
The indicator is part of an overall range trading plan and should not be the only variable you use for making a trading decision.
Range Trading Strategy Outline
Simple still works in trading and the key is discipline and consistency. Without those, any type of success will be short lived regardless of the merits of your trading system. As you head into the trading strategy, keep in mind everything you've covered up to here.
Find Our Trading Range
Trading ranges are formed with support and resistance zones. You can look for current ranges or find trending markets that are starting to slow down. Ranges turn to trends and trend turn into ranges.
I also consider pullbacks a range in the general sense but those won't be a covered topic here.
This chart has an uptrend in play and then price started to pullback. The high is marked off and once the pivot low is in place, that is marked as well.

For the trend to continue, you need to see a higher high. If that does not develop, you can start thinking of a range play. The chart shows that price didn't advance into a trend continuation after the low as you put in a lower high marked "X" but fail to make a lower low.
I choose a not so perfect example of a range as showing perfection is always easy to do.
Location Of Price
With the extremes of the range marked off, you now have areas where you can monitor what price does and if you have a trading opportunity. In our example chart, the yellow highlights areas of interest.
- Price revisits the low. Indicator is oversold. Momentum line cross. Inside bar candlestick.
- High is tested. Consolidation below extreme calls for caution. Candlesticks start showing a lack of momentum and inside pattern. Indicator oversold and cross.
- Price fails before an extreme test. Indicator not in the overbought zone. Good reversal pattern but no trade.
- The indicator in the middle zone. Bearish momentum cross. No reversal pattern. Price breaks through extreme.
Quick strategy recap
We needed price to make an attempt at the extremes. When that condition was met, we wanted to see an oversold/overbought indicator position. A bullish/bearish momentum cross helped build our case for a trade and then we needed to see a reversal pattern in the price action.
Place The Protective Stop
You would think that placing your stop just outside of the extreme would make sense. After all, you often read that you should place the stop where you would be proven wrong.
The problem is that you can have the extreme broken and the trade (and range) is still valid.
Think back to the expanded range chart and you can see that the range play is still a valid trading opportunity.
The range still exists but with different extremes.
There is a pattern called a failure test that needs to break an extreme and can take you out of your current trade when you should actually be getting into a trade.
What about a distance away from the extreme? How far is far enough?
Given that most people base their position size on their stop size, this could lead to very small positions or, depending on the market and your capital, no trade.
Inside the range? Thinking about where the majority of people put their stops (textbook stops), where do stop runs usually go?
If you know that most traders use either the extreme or a little bit beyond, those that can run the stops know that as well. Depending on the market and trading volume, a stop run could have traders exiting at prices beyond their stop due to slippage.
Stop orders once triggered turn to market orders to be filled at the best price.

If you were short from the extremes and your stop was placed just outside the extreme, you'd be taken out before the trade is able to mature. If stopped out, this trade may have had slippage giving you a worse risk profile than you planned for.
If the price is going to come close to the extreme, it is probably going to test the extreme and slightly beyond. A stop just inside of the extreme will have you out of the trade before the stop runs trigger.
The fact is there is not a perfect location for the stop that will still allow an optimum position size.
Thinking of yourself as a risk manager will aid you in your stop placement decision.
Range Trading Blueprint
How you end up trading ranges is going to depend a lot on the type of trader you want to be. There are a few important variables to pay attention to however it can be simply summed up with:
Find the extremes of the trading range. Look for signs of reversal. Take a position and manage it.
Whether you are range trading Forex, Futures, or any other market, the basics that were covered here apply. Take your time, test, develop your trading plan, and be consistent with how you have chosen to trade.