Keltner Channel Trading Strategy
One thing you want to be aware of when trading an indicator method such as the Keltner Channel trading strategy is that, like all indicators, there is a lag time.
Indicators are derivative of price meaning that the results that you see via an indicator will come via a calculation using the price you see on your chart.
Price first.
Indicator second.
Before we get into the strategy that you can use with the Keltner Channel indicator (Keltner bands), let's cover why a channel can be useful for any trading strategy.
Channels Measure Extremes
It is the buying and selling by humans (and computers although the trading programs are programmed by humans) that will move price. As humans, we are susceptible to emotions and beliefs and emotions are even more vulnerable when money is on the line.
Channels, and this includes Bollinger bands and moving average envelopes, are theoretically designed to surround the general price action of the charted instrument.
The key words are "general price action" because anything seen outside of the general movement of price can be considered an extreme movement.
One way to envision this general movement is consider that the price is travelling without an extreme bullish or bearish bias. While there may be an overall bias in one direction, there is nothing out of the ordinary with the movement of price.
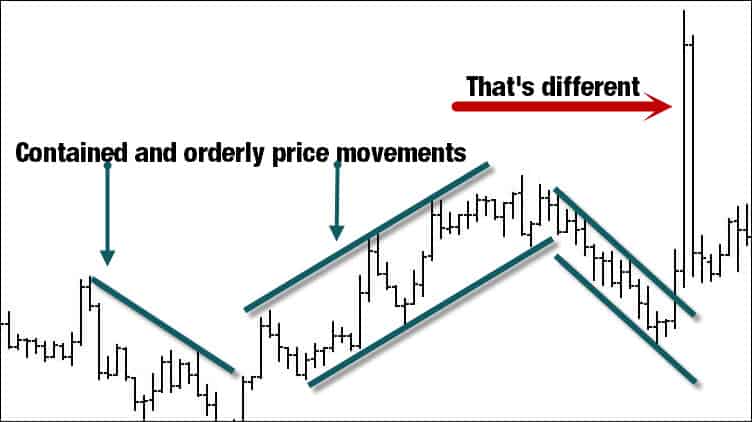
There are times when a "that's different" moment takes place and the price will make a move in one direction or the other.
This is the time when you want to be on alert for potential trading opportunities as it is clear that volatility has increased. You use the word potential because you don't want to take a trade based on one indicator alone.
There are other things to consider but we can use the Keltner channel bands that surround price and the channels moving average as an alert for possible opportunity.
The bands do not act as a physical barrier to price just as moving averages do not magically support price.
They are a measure of volatility in the case of the bands and consensus when referring to moving averages.
Keeping that truth in mind, you can see how important it is not to just "push the buttons" because the price has found itself in those locations.
The Moving Average Consensus
The Keltner channel is plotted with two outer bands and through the middle is a 20 period exponential moving average (EMA).
Using the moving average as an area of general agreement in price, we can see when price moves away from it that one side is favored over the other. The further price moves away, the more we expect a snap back in the price.
The moving average can also act as the landing zone after the price makes the snap back and when I say zone, I mean we don't expect price to land directly on the average. That is why we don't simply execute trades when price is supporting or resisting in the area of a moving average.
Keltner Channel Settings
Like most indicators, there are inputs that you can change and that in itself can offer up a whole different set of problems.
There are several settings we can change with the Keltner channel depending on your charting platform:
- Moving average length (will determine lag time of channel)
- Average true range (ATR)
- Band multiplier (uses ATR reading)
- Moving average type (EMA, SMA)
- ATR type (EMA, SMA)
The band multiplier is a very important number as it will determine how tight the outer and lower bands are to price. If the bands are tight, you may get a lot of excursions to the bands and beyond. This may be suitable for those scalping with the Keltner channel but not suitable for those looking for longer term plays in their instrument.
Day trading is also a viable option with the Keltner channel and you can tweak the band multiplier to suit your trading needs.
Keltner Channel VS Bollinger Bands
There are those that often confuse the BB and KC but they do act differently in terms of reaction to price. The big difference is the Bollinger band is calculated using a standard deviation while the Keltner uses ATR.
You can visually see how Bollinger bands reacts differently with sudden price shocks.
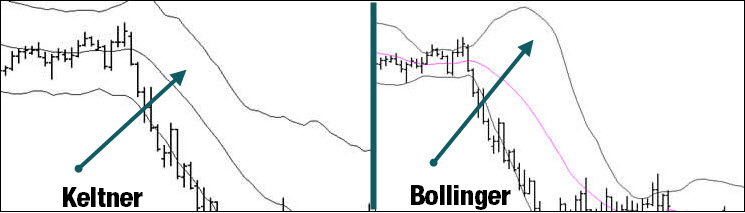
Some traders utilize the Bollinger bands and the Keltner channel together to show a Bollinger squeeze. When the Bollinger is inside the keltner, the squeeze is on and when in a trade setup, the movement of the bands outside of the channel is the trigger. This would indicate that the price is potentially about to go on a run.
Whether you are going to use the channel or Bollinger indicator for this trading system, is not the point. You can use either because it is the concept we are looking at.
Price Channel Trading Plan
The original Keltner used a 10 period for the moving average but it caused traders to be whipsawed around far too much. Over time, the popular setting became a 20 period EMA, a 20 period ATR and a 2.25 multiple. You can of course test various settings but in the end, we are simply looking for price engaging with either of sides of the channel.
Pullback Trading
Trading pullbacks is best done in a market that has exhibited a strong push in a direction. This is based on swing analysis where you want to see conviction in a market swing that indicates another move in the same direction.
Using the Keltner channel, we can use travel outside the bands as an indication there was conviction in the swing.
If we are trading in an downtrend, you want to see price travel to the bottom channel and plot outside of the channel. Even a shadow plot is sufficient if you are a more aggressive trader.
Remember, an excursion outside of the channel indicates an extreme from what was a considered normal price action.
When price is at the channel, that is an alert to look for a pullback in the price to an area around the 20 period EMA.
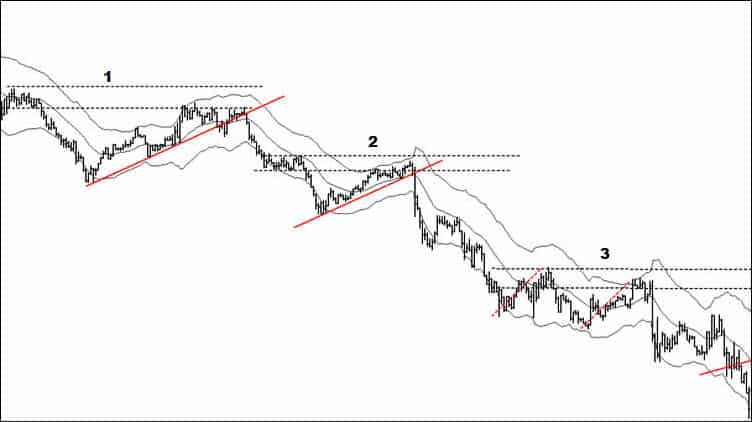
This chart shows a down trending market in play. Highlighted by the orange color, you can see that price has traveled outside of the channel. This is the first sign that we may have a trade if the pullback fits other criteria. In certain charting packages, you can set an alert that will signal you if/when price has hit the channel and some of you may find that useful.
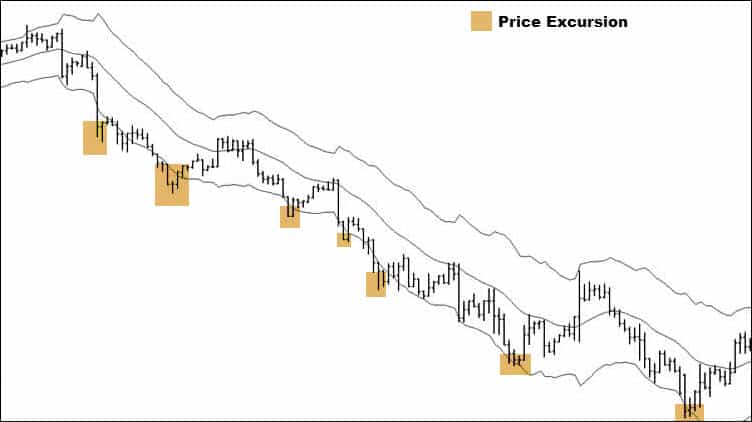
Not all excursions equaled a pullback into the zone around the moving average and as you can see that at times, price traveled along the channel. That issue will be covered in a later trading tips segment.
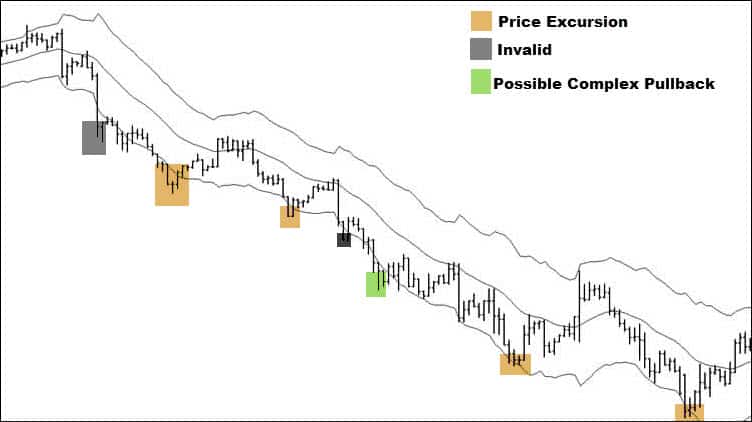
We now have three definite pullbacks that met our criteria of:
- Excursion outside of channel
- Pullback to area of 20 EMA
- Obvious trending market
Confluence and Trade Triggers
Our potential trade is now being setup but we still don't simply enter when price touches the 20 EMA. We would like to see price pulling back not only to the mid-line but also to a price structure or exhibiting a topping pattern. This is called confluence and can actually increase the probability of your trade getting some traction.
We need a trigger to get into the trade and there are many tools that you can use. Momentum indicators are a popular method as well as the very basic trend line.
This chart is a factor 4 less than the previous chart. By using a smaller time frame to get into the trade, you may be able to get a better position sizing as you position yourself higher in the curve to the downside in this example.
The black dotted lines on this chart are boxing off structures of possible resistance that coincide with the pullback to the mid-line. Let's call these potential resistance zones because when price is pulling back, we don't know with 100% certainty if price will stop at these areas but it potentially could.
These potential zones of trading opportunity that includes the structure are from the trading chart and I encourage you not to use the trigger chart to find the structure.
The trigger chart is only used for exactly what the name implies.
Before continuing, the area marked three may have some questions. It is a sloppy complex pullback because the second leg did pierce the bottom of the first before reversing from what may be considered a double bottom.
Where this gets interesting is the second leg matches in distance the first leg of the move. This is called symmetry and many traders will utilize this as a stand alone trading system. Price also exhibits a topping pattern, a double top and you can see from this chart that a confluence of factors were in play when price broke solidly to the downside.
I am using standard trend-lines to show the counter-trend move in price which brings us to our setup zone. You may use a standard break of the trend-line for your trade entry.
Stop placements could go either above the turn or above the zone that has acted as resistance.
Trade Targets
We are going to use the setup chart for targets and like trade entries, you have a few options.
Some traders like to target opposing structures while others would like a more objective means to find profit targets.
I've spoken about Fibonacci many times over the years and have shown examples from my own trading. Fibonacci was my original method of trading when I first started and have since refined things since the early days.
The fact that we are trading pullbacks makes it easy to find our targets with Fibonacci in a way that is completely objective. We are going to take the move into the extreme of our pullback and project forward in time to a potential price target.
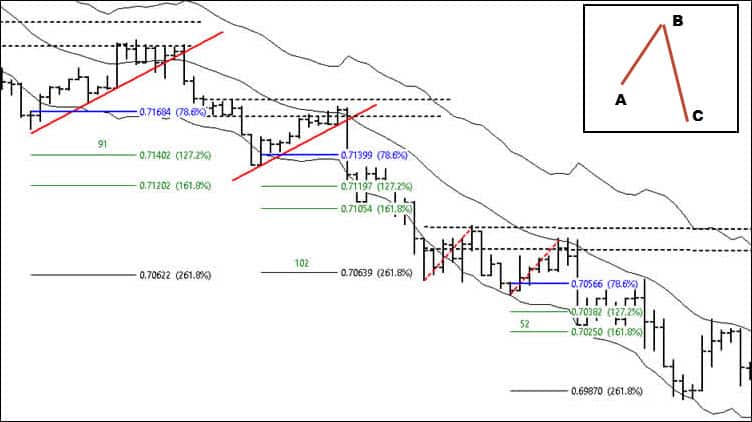
The diagram on the chart shows that "A" is the anchor point and you pull the Fibonacci retracement tool to "B". You project your targets at "C."
Here are the numbers that I personally use and will use for this example. Note that 200 is omitted but I use it for targeting after a range.
- I used the bottom of the structure range for the entry price.
- I use .786 as the stop price once price breached the low of the swing leading to the extreme
- Whatever target price hit just prior to breaching the .786, it was a full exit price.
You can see the total pips for each trade in green for a combined total of 245 pips (Forex example) before spread costs. These targets are shown on the trigger chart for detail.
Complete Trading Plan
This Keltner channel trading system is not complicated but don't be misled by the simplicity. You still have to put in the work in determining the overall trend direction, when counter trend trading is appropriate, extent of excursion plus the very important account management and risk profiles.
That's just to name a few variables.
There are also other trading opportunities that Keltner channel trading may provide and I will cover some of those in a later post.
A lot of work goes into designing a full trading plan including back testing and forward testing. Take a seat in a free Netpicks trading webinar where you can see how a properly designed and tested trading system can increase your trading success. Click here to sign up.