3 Most Useful Day Trading Indicators
Day trading indicators are often touted as the holy grail of trading but that is simply not true.
They are a useful trading tool that should be used in conjunction with a well rounded trading plan but are not the plan itself.
In this article I will cover:
- The uses of trading indicators
- Indicator selection
- Two simple trading methods you can expand on
Keeping Trading Simple
Whether you swing trade, day trade, or even position trade, too many trading indicators equals complexity which usually equals lack of consistency with trading decisions.
Information overload is often the result of traders finding a mix of day trading indicators potentially useful but in fact don't really help in the trader making a profitable decision.
I have used trading tools in different combinations over the years and there are three that I found to initially be the most useful day trading indicators for how I like to trade.
As time went on, simple became my mantra and as a result, my trading decisions were clearer and were made with much less confusion and stress.
Day Trading Indicators Give Information About Price and Volume
Almost every charting platform comes with a host of indicators that those who engage in technical trading may find useful. You simply apply any of them to your chart and a mathematical calculation takes place taking into past price, current price and depending on the market, volume.
Different types of technical indicators do different things:
- Trend direction
- Momentum or the lack of momentum in the market
- Volatility for profit potential
- Volume measures to see how popular the market is
The issue now becomes using the same types of indicators on the chart which basically gives you the same information. While this may be explained as looking for "trade confirmation", what it really does is give you conflicting information as well as more information to process.
A simple example is having several trend indicators that show you the short term, medium term, and longer term trend. From a multiple time frame perspective, this may appear logical.
Many traders though can attest to seeing a perfectly valid setup negated because of a trend conflict and then watching the trade play itself out to profit.
Too much information can cause analysis paralysis which can keep you
from making trading choices that are actually profitable ones.

Looking at just the trading range portion and price relation to the moving average, we have:
- Price below longer term average means short
- Price above medium term means long
- Price above short term means long
Not seen on this chart but the pivot black candle below #2 is actually a retrace into an area where a long trade was the call yet all trading indicators called to short at that time.
That is the main drawback with most trading indicators and that is since they are derived from price, they lag price.
A trend indicator can be a useful addition to your day trading but be extremely careful of confusing a relatively simple trend concept.
Day Trading Question: Day trading involves quick decisions.
Would your trading be better served by simple or complex information gathering?
Useful Trading Indicator Selection
Useful is subjective but there are general guidelines you can use when seeking out useful indicators for your day trading.
One simple guideline is to choose one trend indicator such as a moving average and one momentum trading indicator such as the stochastic oscillator.
In order to explain how these can be useful as day trading indicators, take a look at this chart:
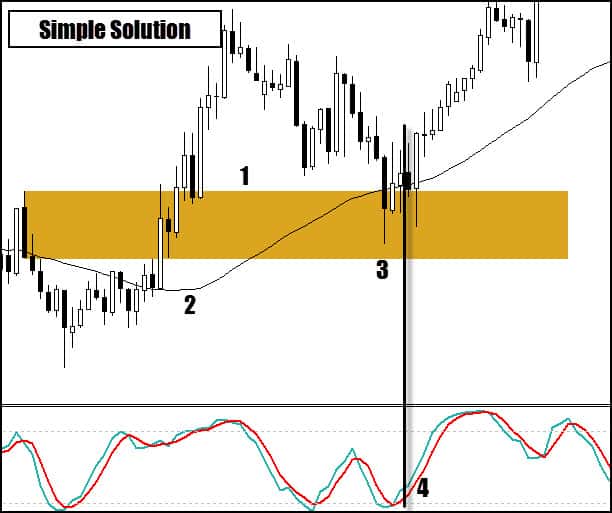
- In brief, this is a pivot area where price broke through and rallied hard away from the moving average
- Price starts to trade above moving average as well as slope of indicator is up and our plan says trend is up
- Price returns to the area marked #1 (also a complex ab=cd retrace)
- Momentum indicator crosses and turns up and we buy stop the high of the candle that turned it
Simple selection of trading indicators mixed with chart technicals can be the basis for your trading system.
Do Trading Indicators Work?
It all depends on how they are put together in the context of a trading plan. Some of
the most used technical indicators such as moving averages, MACD, and CCI work in the sense that they do their job in calculating information.
The power of the indicator lies in how you interpret the information as part of an overall trade plan.
Don't be sold on the "holy grail" indicator that marketers flood your inbox with. Proper usage of basic indicators against a well tested trade plan through back testing , forward testing, and through demo trading is a solid route to take.
All of the systems that are offered by Netpicks not only come with tested trade plans but also hammer home that you must prove any trading system or trading indicator to yourself.
Threat Of Over-Optimization
There is a downside when searching for day trading indicators that work for your style of trading and your plan.
Many systems that are sold use standard indicators that have been fine tuned to give the best results on past data. They package it up and then sell it without taking into account changes in market behavior.
The backbone of many trading systems are very mechanical in the sense that "if A happens, do B".
There is nothing wrong with optimizing to take into account current market realities but your approach and mindset in doing so can either have you being realistic or over-optimizing out of the realm of reality.
One way you may choose to not fall into the over-optimizing trap is to simply use the standard settings for all trading indicators. This ensures you are not zeroing in on the most effective setting for the market of today without regard for tomorrow.
Small List of Useful Day Trading Indicators
As I mentioned at the start of this article, there are three indicators which I personally have had great success with over the years and is how I started.
My trading as evolved as I began to understand other aspects of the trading but these are where I started:
- Fibonacci
- Moving averages
- CCI - Commodity Channel Index
For the sake of consistency, I am going to use the same chart as I previously did. This is a day trading/swing trading chart of 1 hour on a Forex pair.
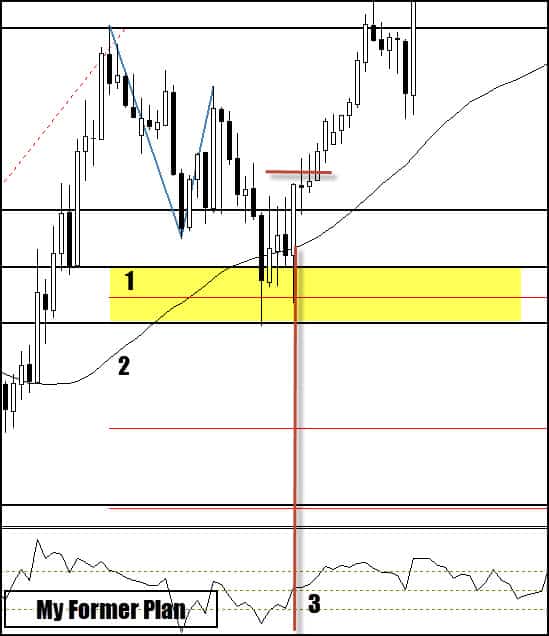
- This zone was determined once the swing high was in place. It is a combination of the Fibonacci retracement and Fibonacci expansion (used for symmetry)
- This is the moving average used for objective trend determination. A short term setting will give you faster trend changes with more whipsaw. A longer term setting can have you miss a large portion of the current move
- Once the CCI comes close to or crosses the 0 level, a buy stop is place above the high.
You can see the trend is up and price has retraced into an area that I would be interested in taking a trade. Once price hits the area, there is a potential setup but a trade trigger is needed to get into the trade.
The commodity channel index plus price moving in the trade direction is the needed trigger.
I purposely left out exact rules and settings (hint - settings are standard) so you can design your own strategy using your current trading knowledge.
This exact setup is applicable to day trading, swing trading, and even position trading
To summarize:
- Moving average - Determine trend and can be part of the process in triggering in a trade and momentum plays. (both not described in this trading article)
- Fibonacci - Determine, in advance of price, zones I may be interested in for a setup and possible trigger. Can also be used for profit targets.
- CCI - Used for trade triggers but does have many uses including trend determination.
Does The Choice Of Trading Indicators Change?
As you can see, this list gives the 3 most useful trading indicators for me at a certain point in my trading.
Times change and what was useful then may not be useful for me today.
Every trader will find something that speaks to them which will allow them to find a particular technical trading indicator useful. Whatever you find, the keys is to be consistent with it and try not to overload your charts and yourself with information.
Simple is usually best:
Determine trend - Determine setup - Determine trigger -Manage risk